
Ever wonder why some surveys or studies aren’t as accurate as they should be?
Bias is the bread and butter of any research methodology, a fundamental aspect that shapes the validity and reliability of findings.
But what is it exactly, and is it that important? We’re going to get up close and personal with non response bias.
Today, we break it down into everyday language, packing in useful tips for anyone interested in research and nonresponse bias analyses.
What is non-response bias?
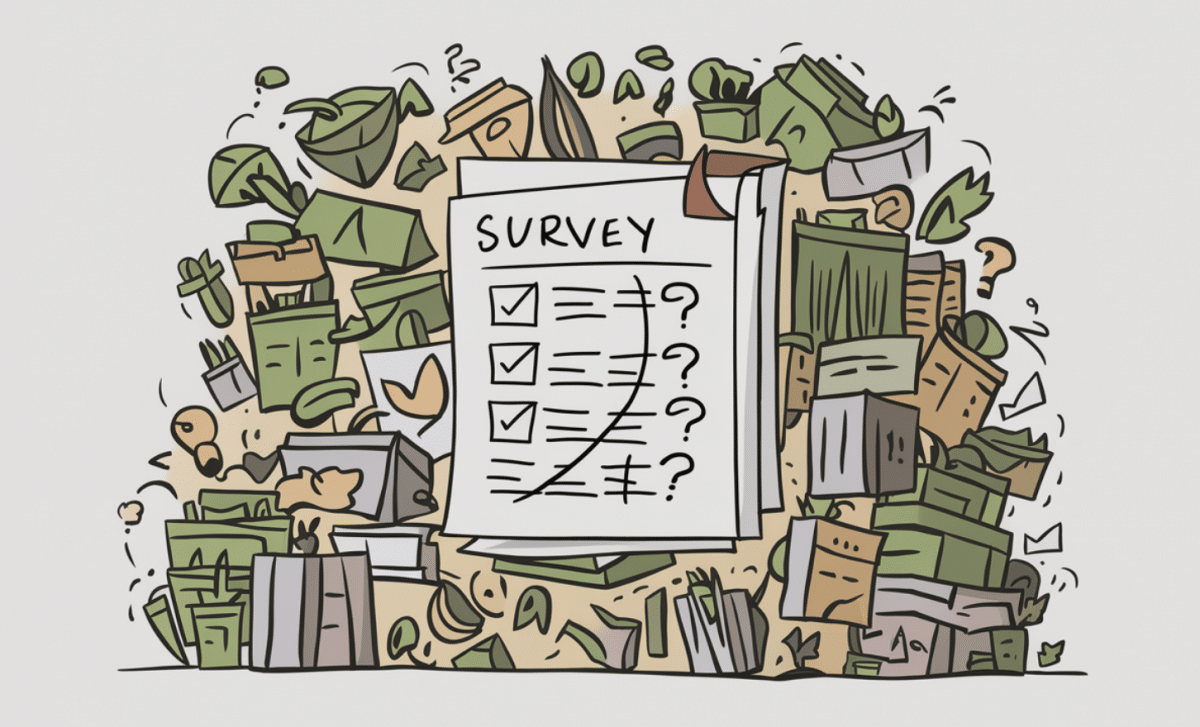
Think about a time when you didn’t answer or participate in a survey. That’s nonresponse bias right there.
The bias might be an issue in health services research and public opinion studies, where it can lead to skewed results and inaccurate conclusions.
The reasons people might not answer can vary – it could be because of poor survey design, outdated customer information, or maybe the survey questions just didn’t click with them. It could be due to differences in demographic characteristics between those who answer and those who don’t.
Let’s say in health surveys, it’s often the ones with poorer health tend skip out the survey and leave us with underestimated health risks.
So, when we miss out on hearing from everyone, we might not get the real story.

source: Designstripe
Factors contributing to non-response bias
Nonresponse bias is a tricky thing in surveys. To avoid it, you need to know why some people don’t answer and how that changes what we think we know.
Here’s the lowdown for survey researchers and not only:
✔️ Demographic differences
Different types of people might not answer surveys, and it matters.
Age, gender, money, geographic differences, and how much school you went to can all play a part. Maybe retired people don’t like answering mail surveys, which means we’re not hearing everyone’s voice equally. This can make demographic differences not accurately represented in the data collected.
📚 Read also: Demographic Questions for Survey: Your Brief Guide.
✔️ Survey design and methodology
Check if your survey is not too long or confusing. Otherwise, people might just give up. How a survey is put together can make a big difference.
And whether it’s online, telephone survey, or face-to-face can affect who answers. Poor survey design, like questions that are too personal or hard to understand, can also make people less likely to respond.
✔️ Respondent characteristics and behaviors
Personal traits and lifestyle can influence survey participation. Busy people or those with less education might not respond as much. Someone who handles a phone call during the survey might get distracted and abandon it altogether, especially if the survey or verification process involves a flash call, which some participants might not recognize or trust immediately.
And when surveys ask about behaviors like lower alcohol consumption, the responses might not be fully accurate if certain groups are less likely to participate.
✔️ Accessibility and communication barriers
Accessibility issues, such as language barriers or lack of internet access, can lead to non-response bias. If people can’t access or understand the survey, they won’t answer. It may exclude large segments of the target population and leave you with non-accurate results..
✔️ Timing and data collection period
The when of a survey can also affect response rates. If it’s a busy time or an off-season, you might not get as many responses. Also, the early and late responders might have different views, contributing to nonresponse bias.
For anyone who’s into surveys, just remember: watch these bits closely. They help catch what people think. Up next, let’s talk about the different types of non-response bias, each one a unique piece of the puzzle.
Types of non-response bias
Different types of nonresponse bias can affect the quality and reliability of survey data.
Unit non-response bias
Unit nonresponse bias happens when entire individuals or households fail to respond to a survey.
➡️ EXAMPLE: In a health survey, if entire households with poorer health are missing, it may lead to an overestimation of the overall health status in the data collected.

source: Designstripe
Item non-response bias
Ever skipped a question on a survey? That’s item nonresponse bias. People might leave out tricky or too personal questions.
➡️ EXAMPLE: When surveying personal finances, respondents might choose not to disclose their income levels. It leaves gaps in the data.
Response rate bias
Response rate bias is related to the overall percentage of people who complete the survey. As response rates fall, the likelihood of non-response bias goes up.
➡️ EXAMPLE: If a public opinion survey on a controversial topic has a low response rate, the opinions of those who choose not to participate might be systematically different from those who do.
Sampling error and bias
When the group taking the survey doesn’t really match the whole target population, that’s a sampling error.
📚 Read also: Margin of Error in Surveys: What is it and How to Tackle it?
➡️ EXAMPLE: A telephone survey that only includes landline users might miss younger demographics who primarily use mobile phones. Instead, phone number validation can be used on mobile phones, and a landline would only be called when there is no alternative
Systematic differences in respondents
Sometimes, the people who answer a survey are just different from those who don’t.
➡️ EXAMPLE: Workplace survey misses out on the really unhappy employees, then we might think everyone is happier than they actually are. The systematic differences can lead to an unrealistic view.
Consequences of Non-Response Bias
Trustworthiness and sharpness of research findings and data analysis may suffer because of nonresponse bias. And it may also lead to some unwelcome consequences.
#1 Skewed results and inaccurate conclusions
Nonresponse bias brings skewed results, as the data collected may not accurately reflect the entire target population. This is a big headache in public opinion research and health surveys.
Whenever those feeling healthier are the only ones responding, then health status appears more optimistic than it is, tweaking health estimates and misleading the public.
#2 Limited generalizability of findings
You can’t bank on the survey’s findings to reflect the wider world when there’s a nonresponse bias. This is a real issue in large-scale surveys like the Current Population Survey. If certain groups are missing, the results, again, won’t mirror the true population characteristics.
#3 Measurement error in outcome variables
This kind of bias means trouble, especially in precise areas like BMC Public Health studies. If survey respondents aren’t a good mix of everyone, then the variables of interest, like how common a health condition is (prevalence estimates), won’t be accurate.
#4 Risk of biased sample and sample bias
Every survey method is at risk of ending up with a biased sample, a major worry in survey studies. It is overrepresenting by certain groups while others are underrepresenting.
For instance, in a survey about self-reported health behaviors, the absence of certain segments can lead to incorrect interpretations of health risks.
#5 Impact on statistical analyses and relative risk
Nonresponse bias makes the data collected less reliable and also scrambles statistical analyses, and complicates the understanding of relative risk.
It’s like trying to bake a cake but leaving out some key ingredients. The results won’t be as good or reliable as it should be.
But there are some ways to prevent that. Read on, and check if you know them all.
Methods to mitigate non-response bias
Try to employ proactive measures to reduce it. We’ve gathered some useful tips for you:
01 Proactive follow-up and reminders
Send extra reminders and boost response rates, especially if your surveys initially have low response rates. This approach helps gather data from a more representative sample of the population and reduces unit nonresponse.
02 Offering incentives
A little thank you, maybe some money or a gift can encourage potential respondents and the target audience to complete the survey.
Incentives like these can motivate potential respondents to complete the survey, particularly in cases where nonresponse differs across different groups.
03 Targeted outreach and engagement
When engaging in public opinion research or trying to leverage customer data, it’s necessary to reach out strategically. Tailor your approach – make the messages personalized and write in a way that your target audience likes. It may all bring in a diverse set of people to provide their views.
04 Adjusting survey design
People are more likely to drop out of a survey if the survey questions are too complicated or too long. Simplify survey design and shorten questions to decrease a nonresponse error. Small tweaks can help more people complete your survey.

Source: Storyset
05 Statistical adjustments and weighted estimates
To combat nonresponse bias, statisticians use weighted estimates. It gives more weight to the responses from groups usually underrepresented in the survey so as to reduce systematic bias and create more balanced results.
EXPERT TIP: Use a reliable tool!
SurveyLab is a top choice for any survey project you have in mind.
It handles multiple question types and offers custom formats to get clear answers. You can add logic to your surveys, too. This feature guides each respondent through a tailored path, skipping irrelevant questions.
The platform shows results as they come, allowing you to make quick decisions based on the latest data. Security is a priority at SurveyLab, so your data stays protected at all times.
Customizing your surveys is simple with SurveyLab. You can adjust the look to match your brand, which makes the surveys more engaging for respondents.
Need a robust tool for your next survey? Check out SurveyLab. It’s easy to use and powerful enough to handle any survey task.
Statistical techniques to address non-response bias
In dealing with nonresponse bias, statisticians have a toolkit to make sure survey data is as accurate as possible, even when some respondents don’t answer.
Here they are:
1️⃣ Weighting adjustments
Weighting is like balancing a scale to make sure each group in the survey counts the right amount. It changes the importance of each answer depending on how likely people are to skip the survey.
2️⃣ Imputation for missing data
Imputation is a statistical method used to estimate missing data. In the context of nonresponse bias, imputation can be used to fill in missing responses, based on the responses of similar individuals in the survey. Very useful in dealing with item non-response.
3️⃣ Propensity score adjustment
It’s calculating who’ll answer the survey. It determines the chances of each person responding and then tweaks the results accordingly. It’s a smart move to even out the effects of non-response.
4️⃣ Post-stratification
After all the answers are in, post-stratification is like a final touch-up. It changes the survey weights to make sure the group that answered fits well with the actual population characteristics.
5️⃣ Calibration
The calibration technique is where survey weights are adjusted so that the survey data aligns with certain known values from the target population. It’s like double-checking your work against the answer key. Researchers can be sure everything fits with the known data about the target group.
6️⃣ Bootstrap methods
Bootstrap keeps picking samples from the survey over and over to see how stable the results are. The technique helps in understanding the impact of non-response on the survey results and in making more robust estimates.
7️⃣ Multiple imputation
Instead of guessing once for missing answers, multiple imputation guesses many times and mixes all the answers together. Using this method, you can handle uncertainties associated with the imputation of missing data in surveys with nonresponse bias.
8️⃣ Analysis of response patterns
Analyzing response patterns helps in identifying systematic differences between respondents and non-respondents. An analysis like this can help adjust for nonresponse bias and boost survey accuracy.
9️⃣ Use of auxiliary data
This is using extra info from outside the survey to fill in gaps. And using auxiliary data from external sources can make up for nonresponse bias.
The data gives more details about the characteristics of non-respondents and improves survey data.
Now, it’s time for some examples.
Examples of non-response bias in research
Here are some real-life examples and case studies showing how nonresponse bias influences research in healthcare, social sciences, and market research.
Healthcare research: self-reported health behaviors
In some health studies, not everyone answers the survey questions. This nonresponse bias means we might not get the full picture, messing up the health estimates for certain conditions.
🤔 Imagine a citywide survey on diabetes management. If most respondents are those without diabetes, it could incorrectly suggest that managing diabetes isn’t a significant issue for the community.
Social science research: survey response rate and demographics
If certain groups, like teenagers, don’t answer surveys, the survey response rate for these groups drops. We end up with results that don’t really reflect everyone’s views, leaving some people’s attitudes out.
🤔 Consider a survey on public transport needs. If younger commuters predominantly don’t respond, it might conclude that there’s less demand for late-night services, which isn’t the case.
Market research: consumer preferences
Market research conducted with nonresponse bias contributes to inaccurate or false answers about what consumers want. Suppose a fashion trend survey misses responses from rural areas, it might overstate the popularity of certain styles.
🤔 A survey is sent to a neighborhood about a new grocery store. If only the well-off respond, the store might stock more luxury items, misreading the broader community’s preferences for basic, affordable options.
Public opinion research: political polling
In political polling, nonresponse bias can drastically sway perceived public opinion. If lower-income households mostly ignore a policy feedback survey, it might indicate higher support for policies that actually have mixed reviews
🤔 A poll on education reform might show strong support for technology in classrooms. However, if the survey misses out on low-income areas where access to technology is limited, it doesn’t truly reflect the whole community’s needs or opinions.
Educational research: student feedback surveys
If a course evaluation is mostly filled out by top students, it may overlook areas needing improvement. So nonresponse bias in student feedback can create an overly positive view.
🤔 A university collects feedback on its cafeteria services. If the majority of responses come from students who eat there regularly, dissatisfaction from those who avoid the cafeteria due to dietary restrictions might go unnoticed, falsely suggesting everyone is happy with the food options.
Employment research: workplace satisfaction
If a company’s survey is ignored by its most stressed employees, it might conclude that workplace stress isn’t an issue, right?
🤔 A large retail company sends out satisfaction surveys. If mainly managers and not the sales floor staff respond, it might indicate higher satisfaction levels and miss out on common issues faced by the majority of employees.
Environmental research: community attitudes towards conservation
When those indifferent to environmental issues typically don’t respond to surveys, it can falsely suggest a community is more proactive about conservation than it is.
🤔 A town conducts a survey on recycling habits. If the environmentally conscious minority mostly fills it out, it might suggest that the entire town recycles diligently, overlooking the need for more education or facilities.
Ethical considerations in addressing nonresponse bias
Addressing non-response bias is not just a methodological concern but also an ethical imperative in research. Ethical considerations play a crucial role in how researchers design studies, interact with participants, and analyze data.
Responsibility to minimize non-response bias
Researchers must tackle non-response bias head-on to keep their study solid and reliable. They’ve got to dig into the causes of nonresponse and tweak their approach so everyone’s included.
Transparency in research methods
Being open about the study’s aims, the survey questions, and data handling is of utmost importance.
Researchers should be clear about how they’re handling nonresponse bias, especially in things like public opinion quarterly, where the sample size and approach can alter the results.
Informed consent
Everyone involved in a survey should know exactly what they’re in for. Researchers need to ensure survey participants are clued in on the study’s purpose and how their input will be used.
Privacy protection
Protecting the personal information of survey participants is non-negotiable. In particular, when dealing with sensitive topics, researchers must ensure privacy is respected.
At SurveyLab, data protection is the number one priority. The tool is GDPR-compliant, so you don’t have to worry about sensitive data. Everything’s safe.
Ethical consideration of survey design
Surveys need to be fair and respectful – no leading or invasive questions, even when the same survey is given to different people.
Addressing non-response variability ethically
Understanding why some groups might not complete the survey is key. Researchers should ensure these groups don’t face unfair treatment or misrepresentation due to completion rates drop.
Ethical use of random samples
When using random samples, the research team must make sure everyone has a fair shot at being selected. This helps prevent bias and ensures a more accurate representation of the population.
📚 Read also: Probability Sampling: Methods, Examples, Differences, and Insights.
Consideration of non-response bias in data analysis
In analyzing the data, researchers need to thoughtfully consider the impact of missing voices. This means being cautious about the conclusions drawn from the research and always acknowledging the limits of the data.
Conclusion on non-response bias and survey data
When nonresponse bias occurs, research outcomes across various fields are not reliable.
Researchers need to be careful and ethical in every step of research.
No matter what you ask people about – their health habits, what they buy, how they feel about society, or self-reported health behaviours – getting each survey question ethically is super important.
Identify target audiences with precision. Understanding how nonresponse bias can vary among different groups helps make the study reflect everyone. Using strategies like a random sample is one way to help get a balanced view of the whole group we’re studying. For example, using a cloud recruitment software to hire someone can also be affected by non-response bias, as it’s essential to ensure that the selected candidates represent a diverse and comprehensive pool of applicants.
Also, use a solid surveying tool like SurveyLab. Sign up today!
As researchers, constantly watching out for non-response bias is part of maintaining the quality and truthfulness of your work. It’s a commitment to accurately capturing the world’s complexities and contributing to knowledge with integrity.
Keep an eye on every part of the process to better understand and represent the diverse viewpoints around.
FAQ on non-response bias
Do you have questions? We may have the answers!
Non-response bias happens when some people don’t answer a survey. Then, the results are less accurate because they might not show what everyone thinks. It’s important because it can change what we learn from a survey.
People might not answer surveys for many reasons. They might find the survey too long or confusing, or they might not have the time. Sometimes the questions don’t relate to them, or they can’t access the survey easily.
To reduce non-response bias, surveys need to be easy to understand and not too long. Researchers can send reminders and offer incentives like a small gift to encourage more people to respond. Making sure the survey is accessible to everyone is also key.
Leave a Message
You must be logged in to post a comment.