
Crafting surveys that work goes beyond just asking questions.
Understanding the data you collect, whether it’s discrete (countable values) or continuous (precise measurements), unlocks a treasure trove of insights.
Let’s check these data types to maximize the power of your surveys!
What is discrete data?
Discrete data refers to countable, whole numbers (or categories) you can easily split into distinct sets.
Think of the number of pets you own (1, 2, 3) or your preferred movie genre (comedy, action, drama).
What is continuous data?
Continuous data exists on a sliding scale and can take on any numeric value within a range. It is similar to how many hours you spend studying daily (1.5 hours, 3.2 hours) or your height in centimeters.
Key differences between discrete and continuous data
Get the differences to get a better understanding of those terms. ⬇️
When analyzing data, distinguishing between discrete and continuous data is super important. We can say that discrete data refers to separate values, like the number of pencils in a box (3, 5, 7) or student grades (A, B, C). It’s countable and typically represented by whole numbers.
Continuous data exists on a continuous spectrum. Like ruler’s markings – height (1.7m), weight (58.3kg), or time spent studying (2.5 hours) are all continuous data points. The values can theoretically have infinite decimal places within a range.
Discrete vs continuous data: examples and applications
Many businesses encounter both data types.
➡️ Discrete data examples include the number of customers served daily, website clicks, or inventory levels – numerical data. It’s often visualized using bar charts, and it highlights frequencies of distinct values.
➡️ Continuous data examples include temperature readings, product weight, or customer wait times. These are best represented by line graphs, as they show trends and variations across a continuous spectrum.
💡 Likert scale questions rely on continuous data.
Leveraging discrete and continuous data for valuable insights
Examining the average number of customers served daily (discrete) might suggest staffing needs. Meanwhile, analyzing continuous data points like customer wait times can reveal bottlenecks in the service process.
Businesses can combine both data types. Then, they gain a more comprehensive understanding of informed decisions.
Beyond discrete vs continuous: exploring other data types
While discrete and continuous data are common, data comes in many forms.
Qualitative data, like customer reviews (positive and negative), can’t be easily quantified. Unstructured data, such as social media posts, requires specific techniques for analysis.
📚 Read : Quantitative and qualitative surveys.
A data analyst’s toolkit includes statistical software to handle various data types for extracting meaningful insights from all available information.
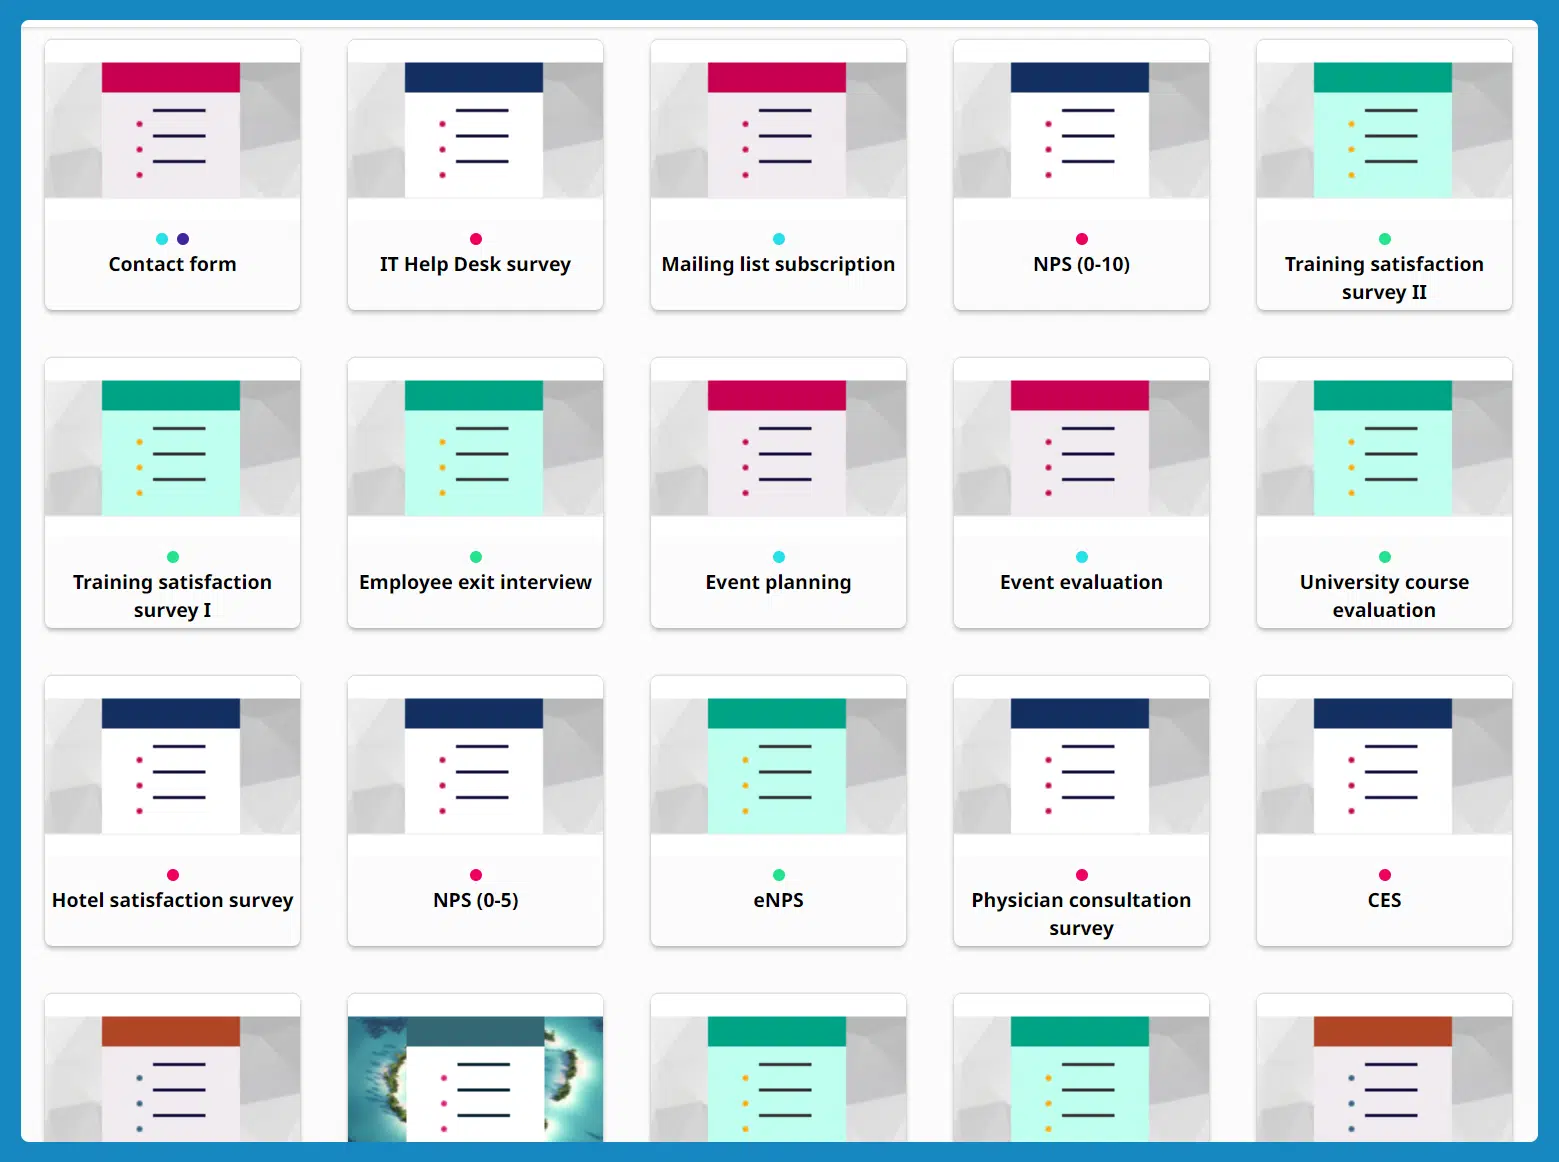
A great help for gathering both qualitative and quantitative data is SurveyLab. It’s a surveying tool with plenty of question types, Thanks to its robust analytical capabilities, you can analyze any type of data and get them easily visualized.
Sign up for SurveyLab, and make collecting discrete variables and continuous variables a breeze.
The power of discrete vs continuous data in different fields
Discrete data plays a vital role in education. Analyzing student performance (discrete grades) helps identify areas needing improvement.
In healthcare, continuous data like blood pressure (measured value) is crucial for diagnosis.
Understanding both discrete vs continuous data empowers professionals across various fields to make informed decisions based on a richer perspective of the data they handle.
What to choose for your survey analysis: continuous and discrete data?

Source: Storyset
Discrete vs continuous data in surveys: choosing the right tool
Crafting your survey requires selecting the appropriate data type, discrete or continuous, for effective analysis.
If you already know what data you need to collect – discrete data (that consists of countable values, typically represented by whole numbers), or continuous data (decimal points within a given range) you need to choose a tool that can measure it.
SurveyLab, with so many question types available, will make this task way easier for you.
📚 Read : Right scale selection for online survey.
When to use discrete data in surveys: capturing specific preferences
Discrete data shines in surveys when capturing specific preferences or categories.
For example, a question about preferred social media platforms (Facebook, Twitter, Instagram) generates discrete data.
Similarly, a question about the number of languages spoken (1, 2, 3+) provides discrete values that can be easily analyzed using statistical software.
Bar graphs visualize discrete data and highlight the frequency of each chosen option.
Leveraging continuous data in surveys: measuring variations
Continuous data is ideal for capturing variations and detailed measurements in surveys.
Let’s say you ask about daily sleep duration – responses (7.5 hours, 8.8 hours) represent continuous data points.
Also, a question about height or weight generates continuous data that can reveal trends or patterns when analyzed.
Line graphs are best suited for visualizing continuous data. They give a clearer understanding of how values change across a given range.
Beyond discrete vs continuous: exploring other data options
Discrete and continuous data are fundamental, but surveys may also include qualitative data.
Open-ended questions about customer satisfaction (positive/negative experience) generate qualitative data that can’t be easily quantified.
Data analysts use various techniques to analyze and categorize qualitative data – they need to extract valuable insights from non-numerical responses.

Source: Storyset
Examples of discrete data
Discrete data surrounds us in our daily lives! They are countable bits of information, like the quantifiable details we can easily split into separate categories.
Here are some fun examples to wrap your head around:
- Movie marathon mania – How many movies do you typically watch in a weekend? (1, 2, 3, etc.) – Discrete! Notice how the answer jumps from whole number to whole number, with no values in between.
- The outfit of the day – Do you tend to wear jeans, dresses, skirts, or shorts more often? (Choose one) – Discrete again! Each clothing option is a distinct category.
- Stacking up skills – How many different languages can you speak fluently? (0, 1, 2, etc.) – Discrete! You can’t speak 1.5 languages, only whole numbers apply here.
- Level up! – In a video game, what’s your current level? (10, 25, 42) – Discrete! Video game levels are typically achieved in whole number increments.
- Sharing is caring – How many slices of pizza do you usually have in one sitting? (1, 2, 4) – Another discrete example! Pizza slices come in whole numbers, not decimals (unless you’re sharing with a very precise friend).
These are just a few examples of how discrete data pops up in our everyday world. When you understand these countable categories, you can analyze information and make data-driven decisions in all sorts of situations!
Examples of continuous data
Continuous data takes us on a journey of precise measurements, existing on a smooth, unbroken scale.
Unlike discrete data with its countable jumps, continuous data offers an infinite number of possibilities within a range.
Let’s explore some everyday encounters with continuous data:
- Time traveler – How long did you spend baking those delicious cookies? (30.5 minutes, 42.75 minutes) – Continuous! Time can be measured in precise increments, from milliseconds to hours, with endless decimal value possibilities.
- The temperature is rising – What’s the current temperature outside? (22.3°C, 17.8°C) – Continuous again! Temperature readings can fluctuate throughout the day, taking on any value within a specific range.
- The height of success — How tall are you in centimeters? (175.2 cm, 168.9 cm) – Continuous! Height can be measured in precise centimeters or inches, with endless variations between whole numbers.
- The weight of knowledge – How much does that bag of groceries weigh? (3.7 kilograms, 5.2 kilograms) – Continuous! Weight can be measured down to the very gram, providing an exact value on a sliding scale.
- Speed demon – How fast were you cycling in kilometers per hour? (18.3 km/h, 25.1 km/h) – Continuous! Speed can be measured in various units, with precise decimal values reflecting how quickly you zip past.
Here you are – a few examples of how continuous data weaves itself into our daily experiences.
The examples are all easy and digestible, but if you understand these simple yet precise measurements, you can analyze any kind of information with greater detail and make informed decisions in various aspects of life!
Can discrete data and continuous data work together?
Yes, they can be a powerful team!
A discrete variable and continuous data seem like opposites, they can actually work together beautifully in surveys to paint a richer picture of your audience.
Here’s how:
They unveil hidden patterns
You ask a question about “free time spent exercising per week” (discrete – choose from options like “0-30 minutes,” “30-60 minutes,” etc.). It’s a good starting point.
But what if you also ask a follow-up question about “average number of push-ups performed” (continuous – enter a numeric value)?
This lets you analyze if people who choose “30-60 minutes” of exercise tend to do more push-ups (indicating higher intensity) compared to those who choose “0-30 minutes.” Combining these two approaches reveals hidden patterns within your data.
You can add depth to discrete options
Suppose you asked about “preferred music genre” (discrete – choose from Rock, Pop, Country, etc.). This is great, but it doesn’t tell you the whole story.
You can add a follow-up question asking participants to rate their level of interest in each genre on a scale of 1 (not interested) to 5 (love it) (continuous). It gives a more nuanced understanding of their preferences.
The “why” behind the numbers is clear to you
Take for example the question about “number of online purchases made in the last month” (discrete). It’s a valuable metric, but to understand the “why” behind it, you could ask a follow-up question about “satisfaction with recent online shopping experiences” (discrete – choose from satisfied, neutral, dissatisfied).
Then, you see if people who make more purchases are generally happy with the online shopping experience or if there’s room for improvement.
Conclusion
As you mix discrete and continuous data, you move beyond basic counts and delve deeper into the “whys” and “hows” behind your survey responses. You can empower yourself to make data-driven decisions that click with your audience.
So, next time you design a survey, think about how these two data types can work together to unlock a whole new level of data!
But to make it even more powerful and easy, don’t forget about the right surveying software. Sign up for SurveyLab, and make collecting and analyzing data enjoyable.

Source: Storyset
FAQ on discrete data vs. continuous data
Discrete data has set numbers. Continuous data ranges between any numbers.
A data analyst mixes them to find patterns and better understand survey results.
Quantifying qualitative data helps businesses to turn opinions into clear, measurable info.
Time spent sleeping, measured to the minute, is a continuous variable.
They provide both broad categories and detailed measurements that boost data interpretation.
Leave a Message
You must be logged in to post a comment.