Cross tab reports
SurveyLab provides correlation and cross-tab reports analysis (pivot tables) with multiple variables.
To create cross-tab reports :
- Go to survey report.
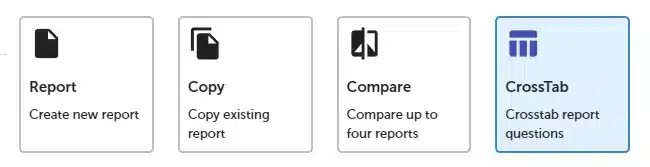
- Press + ADD REPORT button.

- Select CrossTab.
- Add variables (rows, columns) you want to analyse.
Set Columns
| Questions | Select question. |
| NPS | Select NPS. |
| Matrics | Select metric. |
| Reports | Select report. |
Set Rows
| Questions | Select question. |
| NPS | Select NPS. |
| Metrics | Select metric. |
| Reports | Select report. |
| Contacts | Select contact details (custom 1, custom 2, …) |
Set Filter (report)
Select a data source for your cross-tab report.
NOTE. To create a CrossTab report, you need to add at least one variable in a row and one in a column.
You can add only single and multiple-choice questions to the cross-tab report. From the analytical point of view, it doesn’t matter how you arrange variables (rows, columns).
Below the report, you will find a chi-square test.
![]() Functionality is available in the Professional and Enterprise plan.
Functionality is available in the Professional and Enterprise plan.