
What if your next big decision didn’t come from a hunch but from a hundred voices saying the same thing in slightly different ways?
That’s the quiet power of survey research. Every ticked box and typed comment carries a story. But unless you’ve got hours (or a knack for Google Sheets gymnastics), pulling out anything useful from all that raw data is rough.
That’s where survey analysis software comes in handy.
It can organize multiple sources of feedback (such as qualitative data and quantitative data) and turn it into charts and trendlines to let you compare results and act on what your survey respondents are telling you.
Sound useful? Then let’s dig into the topic of survey analysis software.
What is survey analysis software, and why do people use it?
Think about all the survey data you collect: ticked boxes, open comments, 1-to-10 ratings.
Now imagine sorting through that by hand. Exhausting, right?
Survey analysis software does the “dirty” job. It reads through survey responses to organize them and spot the patterns you probably wouldn’t catch with your own eyes. No matter if you’re running complex surveys with thousands of data points or just want to make smarter decisions based on real feedback, analysis tools save your time and your sanity.
And they really reveal what matters, like which product feature gets praised the most or how sentiment has shifted since your last campaign. With a few clicks, your raw data turns into a clean, readable story.
Who needs analysis software? (hint: it’s not just data nerds)
If you run a business, lead a team, or pitch ideas to stakeholders – you need insights. And unless you love Excel gymnastics and 400-row Google Sheets, software is the smarter route.
Don’t think of it as a tech tool for analysts. Think of it as a decision support system. Something that turns feedback into foresight.
Analyzing data is part of smart decision-making for any role
Marketers, product managers, HR leads, sales strategists. You all have questions.
- Why did our last campaign flop in one region?
- What do candidates really think of our hiring process?
- Where are we winning (and losing) customers?
Survey data analysis connects the dots. It makes it easy to spot key drivers or red flags that deserve your attention. Not just for reports, but for real-world action.
Key analysis features you’ll actually use (and a few you probably won’t)
Some features are all bells and whistles. Others? They’re the workhorses you’ll come back to again and again.
You’ll actually use:
- Interactive dashboards
- Sentiment analysis
- Filters for segmenting survey respondents
- Time-based comparisons
- Net Promoter Score tracking
- Statistical tools for significance testing
- Export to Excel, PDF, and Google Sheets
You probably won’t (but hey, they’re there):
- Predictive analytics for future response modeling
- Advanced analytics on partial survey results
- Deep AI coding on open-ended responses
All in all, the best tools won’t overwhelm you. Instead, they’ll put the right features within reach and let advanced users dig deeper if they want to.
Advanced tools that help with market research and reporting
For market researchers and data pros, research software with advanced analytics is gold. Think|:
- cross-tab reports,
- correlation analysis,
- significance testing,
- and rich visualizations.
You can compare data sources and even run multiple surveys from one dashboard. The result? Detailed reports that actually move the needle.
Before you choose: check data analysis power, pricing, and reviews
There’s no shortage of survey tools, that’s for sure. In fact, we have reviewed tons of them on our blog. But not every one of them is built to handle deeper insights or new data types like open-ended comments or behavioral tracking. Before you commit, it pays to dig deeper.
First and foremost, ask the right questions:
- Can it analyze individual responses as well as aggregated views?
- Does it include key features for both simple reporting and further analysis?
- Can I work with multiple sources of data quickly without jumping between tabs or exporting endlessly?
- Is it easy to share insights with other platforms or your team premier?
- Will it scale if I start using more surveys, or collecting other data later on?
- Are dashboards flexible enough to display other features I care about?
- Can I dig into powerful tools like correlation mapping or segment-based filtering?
- Does the export system allow for updates, filters, and comparisons over time?
Additionally, pay attention the pricing.
Look for tools billed annually or monthly that align with your actual usage, not inflated enterprise bundles packed with functionalities you’ll never touch.
Lastly, reviews on platforms like G2 and Capterra will help you spot red flags early, especially from users in similar roles. Bonus points for feedback that mentions how well the tool works with other platforms or supports newer data types.
In short: the right tool doesn’t just look good in a demo. It helps you gather data to quickly compare results across time or segments and make smarter decisions without wasting your team’s time.
SurveyLab: The best tool to create custom reports without the fuss
If you know a survey analysis tool is what you need, we’ve got a strong recommendation.
It’s called SurveyLab. And yes, it’s our own platform. We’re proud of it, and that’s for good reasons. Let us show you why it’s the best choice for your survey analysis needs.
SurveyLab is built for decision-makers who need depth and real control over how they work with survey data.
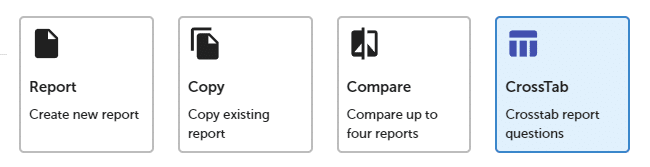
Start with custom cross-tab reports.
With just a few clicks, you can create pivotal tables that reveal relationships between multiple variables. Set up rows and columns using single- or multiple-choice questions, apply metrics like Net Promoter Score, and instantly spot correlations. Each report includes a built-in chi-square test so you know when your results are statistically relevant.
Want something more dynamic?
Dashboards in SurveyLab let you mix and match data points from multiple surveys onto one page. Track KPIs across your business, monitor multiple segments side by side, and update layouts as you go. Everything lives in one interactive workspace. And yes, you can share it with your team.
You can also automate how data moves.
Trigger Slack alerts, send summary reports by email, or even push updates to Zendesk or via webhooks. Set conditions for when a new response is collected or when the status of a response changes.
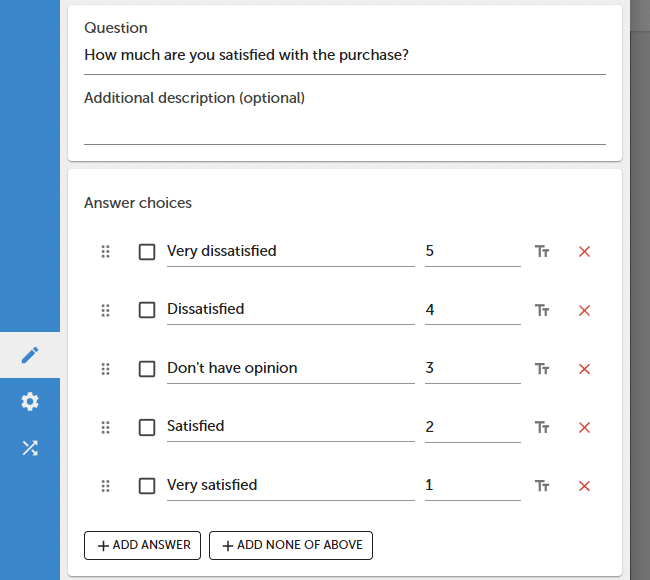
SurveyLab’s metric engine is equally powerful.
You can calculate Net Promoter Score, CES, CSAT, or build custom formulas using points and percentages. Metrics are processed in real time, and you can use them to run online tests or even trigger automated notifications.
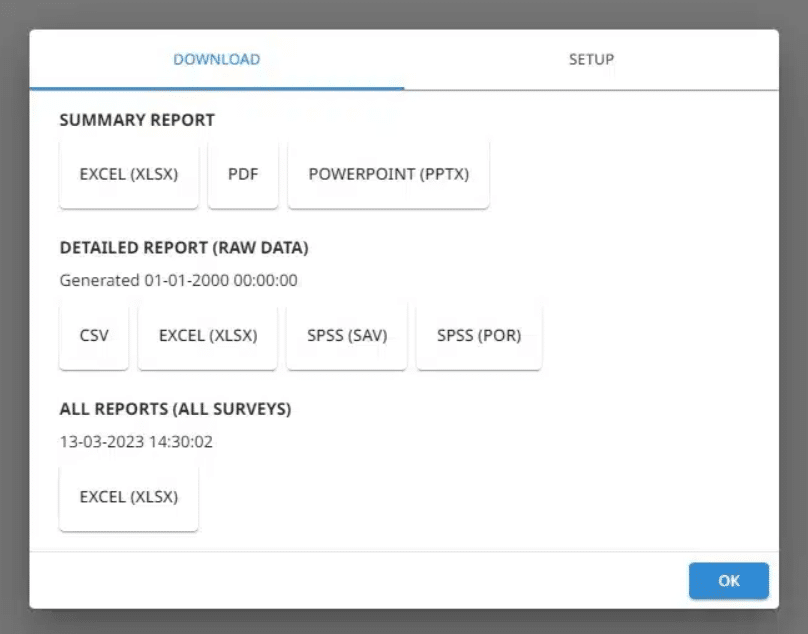
When it’s time to export, you have options: CSV, XLSX, SPSS, PDF, PowerPoint.
Export raw data for further analysis or download compact views for presentations. Partial responses? You can include those, too. Data is updated in real time for surveys with fewer than 10,000 responses, or close to real time for larger volumes.
Filters are easy to apply across reports.
Thet let you isolate segments by demographics or custom fields. Want to see how women aged 20–30 responded compared to others? It takes seconds.
For qualitative feedback, SurveyLab lets you tag open-ended responses and apply smart labels.
These tags feed into your reports and can even be used in dynamic notifications, like showing the name of the respondent or custom data fields in an email.
In short: SurveyLab is built for people who need data to do more. No matter if you’re building advanced dashboards or running statistical comparisons, it puts you in full control without burying you in complexity.
And the best part? You don’t have to believe our word. Try SurveyLab completely for free now and see everything for yourself.
Why SurveyLab does more than Google Forms or others ever could
Google Forms is fine until it’s not. When you need deeper analysis, visual dashboards, custom metrics, and response triggers, Google just doesn’t keep up.
SurveyLab, on the other hand, is for power users and everyday decision-makers alike. You don’t need a statistics degree to get meaningful insights. But if you have one, there’s plenty under the hood.
Think automatic metrics. Multi-survey dashboards. Advanced exports. Smart filters. SurveyLab is the upgrade you didn’t know you needed.
Analyze survey data and get actionable insights easily
Survey data is only as useful as what you do with it. That’s why having survey analysis software is very useful.
From reading unstructured data to turning raw numbers into charts, the right software brings clarity. It highlights key factors and saves you hours chasing scattered insights.
No matter if you’re after quick wins or deep dives, tools like SurveyLab make the whole process faster and smarter. One platform. Multiple surveys. All the survey data you need at your fingertips.