Survey reports
SurveyLab provides various analytical tools that allow you to conduct advanced response analysis directly in the system.
GRAPHICAL REPORTS
To open a report and start data analysis :
- Press
 REPORT button or press 3. Analyze results button on the left menu.
- You will see a Summary report with aggregated data for your survey. To view individual responses, go to List of responses or
![[L]](https://www.surveylab.com/UserFiles/640d81fbf8d6/Image/ico_material/outline_format_list_bulleted_black_18dp.png) RESPONSES LIST.
RESPONSES LIST.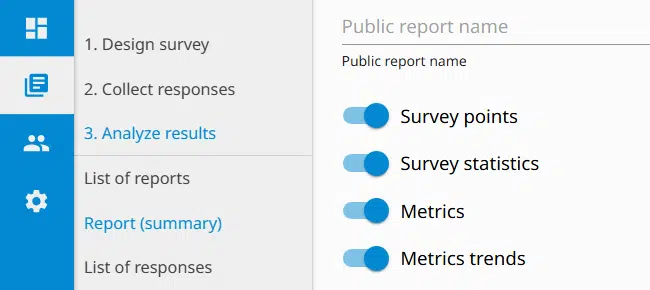
NOTE. In response details, you will see all answer choices, including those that were not chosen by the respondent. Selected answer choices are marked.
RESPONSE STATUSES
SurveyLab can recognise several response statuses that depend on how the survey was finished.
To display report status column in the list of responses :
- Press
![[S]](data:image/svg+xml,%3Csvg%20xmlns='http://www.w3.org/2000/svg'%20viewBox='0%200%2018%2018'%3E%3C/svg%3E) Settings button.
Settings button. - From the Add column dropdown list, select Response status.
| Status | Description |
|---|---|
| Complete | Complete response. It means that the respondent took the survey and pressed “Finish” button. This data is available in the aggregated report. |
| Incomplete | Incomplete response. It means the respondent answered several questions and abandoned survey without pressing “Finish” button. |
| Complete after closed | Response saved in the survey report and locked due to the response limit. It means that the response was completed, but the limit of responses was exceeded for the account. It needs to be Unlocked to be visible in the report. |
| Screen-out | Response finished due to survey logic type “End survey”. |
| Unpaid | Response saved in the survey report and locked due to the response limit. It means that the response was completed, but the limit of responses was exceeded for the account. It needs to be Unlocked to be visible in the report. |
QUESTION SETTINGS
Change data visualisation or delete question data to anonymise the survey.
To change question settings :
- Select question you want to setup.
- Press Settings button and change the settings.


METADATA
For each response, we save basic metadata that includes statistical information: country, language, data, device type, and web browser version.
ADD FILTER
Use filters to track dependencies between collected data or data segments. For example, you can see what answers, for your survey, were given by women, or by people at a certain age. This is a very powerful tool.
To add a filter to the report :
- Select report you want to filter.
- Press Filters button.
- Choose filter options you need.
- Press SAVE button to save the changes.
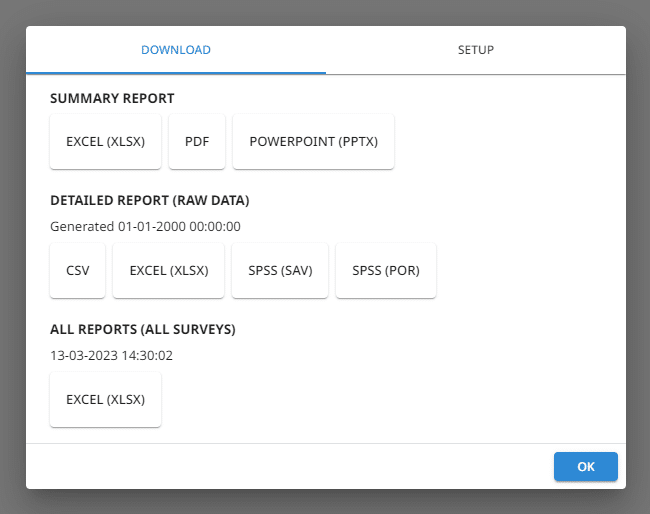
EXPORT DATA
To do even more with your data, you can export it in several formats. Available export formats are grouped into two categories.
SUMMARY REPORT. Present aggregated responses for your survey or collector.
- Excel (XLSX)
- PowerPoint (PPTX)
DETAILED REPORT (RAW DATA). Include all the survey data. Each response is presented in a separate line. Each record includes statistical information like response key, language ID, completion time, or time spent on each page.
- CSV (Comma-Separated Values)
- Excel (XLSX)
- SPSS (SAV)
To export data :
- Press the Download report button.

- [Optionally] Select columns you want to see in the detailed report.
- Select data export format.


NOTE. You will need WinZip or other archiving software that can read ZIP files to open exported data. To download WinZip, please go to 7-zip.org or winzip.com